Carrying on with my Graylog posts, the following will give you an introduction to creating a basic but functional dashboard.
Why do you need a dashboard? Well you can view a number a widgets very quickly which can all be configured with separate search queries. What’s really convenient is that it’s your dashboard, not one that the vendor thinks you will need. Every environment has different requirements. Perhaps you are tracking iSCSI disconnects and want to see a count of the number of iSCSI errors you are getting prior to the event, maybe want to track how many logs vpxa generates, or list the amount of port scans you are getting on your external firewall. It’s really defined by you.
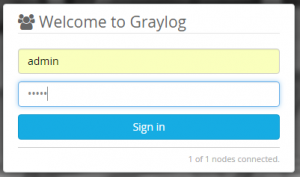
- Browse to your Graylog server and login.
- Click on Dashboard on the Menu across the top.

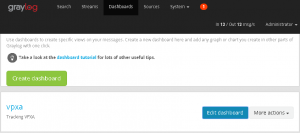
- Once the Dashboards tab has opened click Create Dashboard.

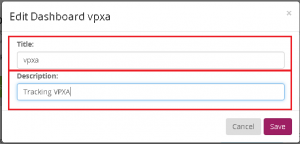
- Give your new Dashboard a name and description.
- You now have a brand new empty dashboard. lets get some widgets generated and add them in.
- Click on Search in the menu bar and in the search field type something that you’d like to keep an eye on. For this purpose I’ve chosen the vpxa. It’s noisy and will be a good example.

- This will return, a histogram and a bunch of messages.
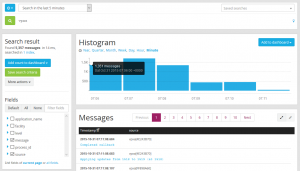
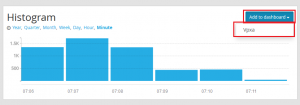
- Lets add the histogram to the dashboard. In the histogram pane click on Add to dashboard and select the dashboard you want to add the histogram to.
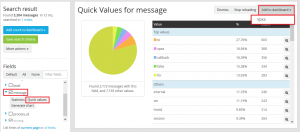
- And lets add one more. In the Fields pane, expand Messages and click Quick Values. Then in the Quick values for message Click Add to dashboard and select your dashboard.
- Go through the various fields and widgets and add what you think will be useful.
- Back to our dashboard. Click on Dashboard in the Menu across the top and then click on the name of the dashboard you just created.

- You’ll now see the widgets you’ve added to your dashboard. You’ll also see three buttons, Update in background, fullscreen and unlock/edit. To rearrange your widgets click unlock/edit and move them around as needed. Update in background keeps the widgets live and fullscreen puts the screen into a display mode which could be useful to display on screens around the IT department.

- Once you are done move things around click lock to take it out of editing mode.
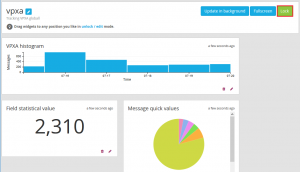
The above does go through creating a very basic dashboard by once again this demonstrates how useful Graylog really is. If you are looking for log monitoring you will be in a safe place with Graylog. The flexibility and scalability, absolutely compete with, and often exceed, the larger paid for rivals.