Monitoring systems usually tell you when there’s a problem and what the problem is, but logs can tell you about the problem, what happened before, and what happened after. In other words logs provide a critical source of information when anything happens in your environment, from the seemingly mundane (NTP update) to the more terrifying (all paths down).
It’s always a good idea to collect logs is some form or another, being able to look through historical logs or requests from support people allows you to start looking for the cause, or a pattern. Usually a log entry gets sent from a system to a syslog box and gets added to the log file created for that system. Not only is it a good idea to have external logging for your ESXi servers but you should also log the VCSA/PSC and any supporting infrastructure, eg “first hop” switches, storage, etc… It still surprises me that many companies don’t actively do this.
Capturing all of that creates a huge amount of data which can be very labour intensive to sift through to get what you need. Apart from something to capture the logs, you should also look at a log organiser, something like vRealize Log Insight, which I really like and have marked to blog about at a later date, or Splunk. Unfortunately both solutions come with a price tag.
And this is where Graylog comes in. “Graylog is a fully integrated open source log management platform for collecting, indexing, and analyzing both structured and unstructured data from almost any source.”
All graylog deployments will have the same basic features: Graylog server, Web interface, Elasticsearch, MongoDB.
 For a first look I would strongly recommend the Graylog appliance that’s distributed as an OVA. The beauty of the OVA is that is can be deployed as an all-in-on solution for smaller deployments, or configured for a single component via the graylog-ctl script for larger workloads. For those of you asking it does have beta support for Docker.
The interface is similar to other loggers, which is not a bad move in my opinion, as its what works best. 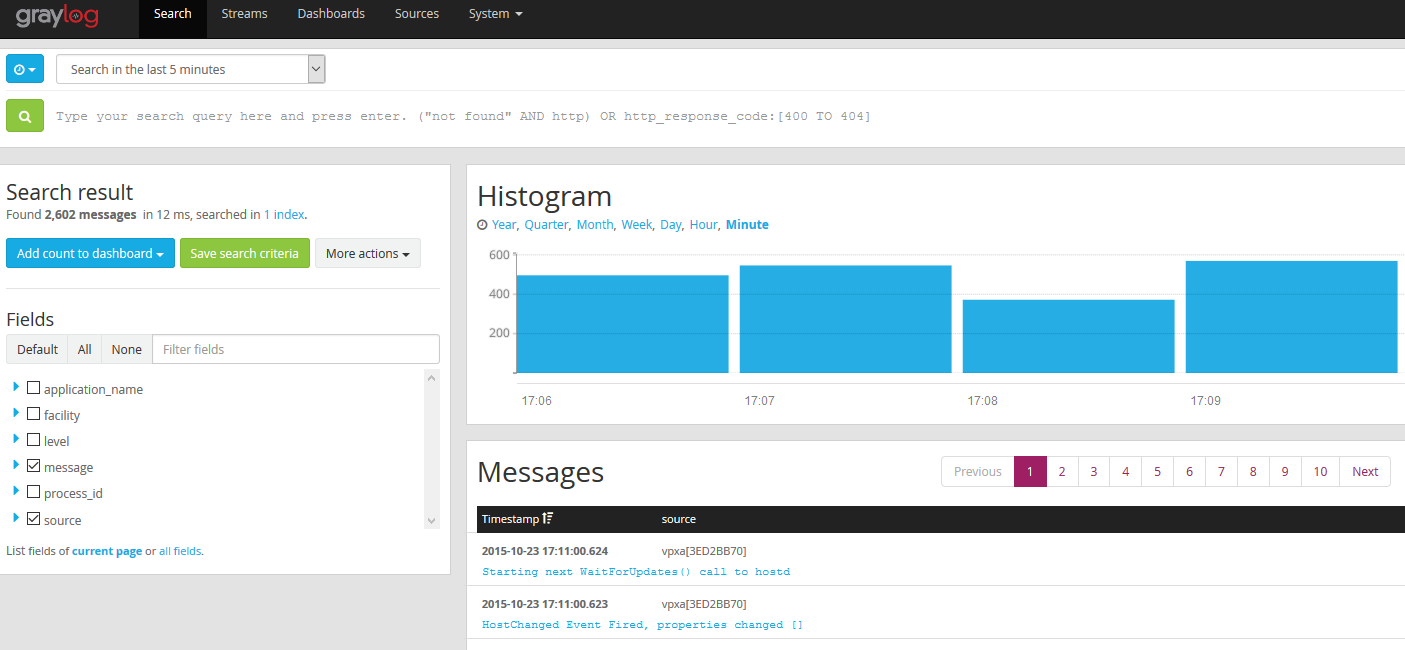
Searches are snappy and respond quickly. The query syntax is simple and doesn’t require you to have a degree in programming. Type esx01 and it will return everything with esx01. Type esx01 esx02 and it with return all entries with esx01 or esx02. But place the two in quotations, “esx01 esx02” and it will look for the exact phrase.
Dashboards are highly customisable and very easy to setup the one below was based on vsan for a rolling 5 minute window and took a couple of minutes to setup.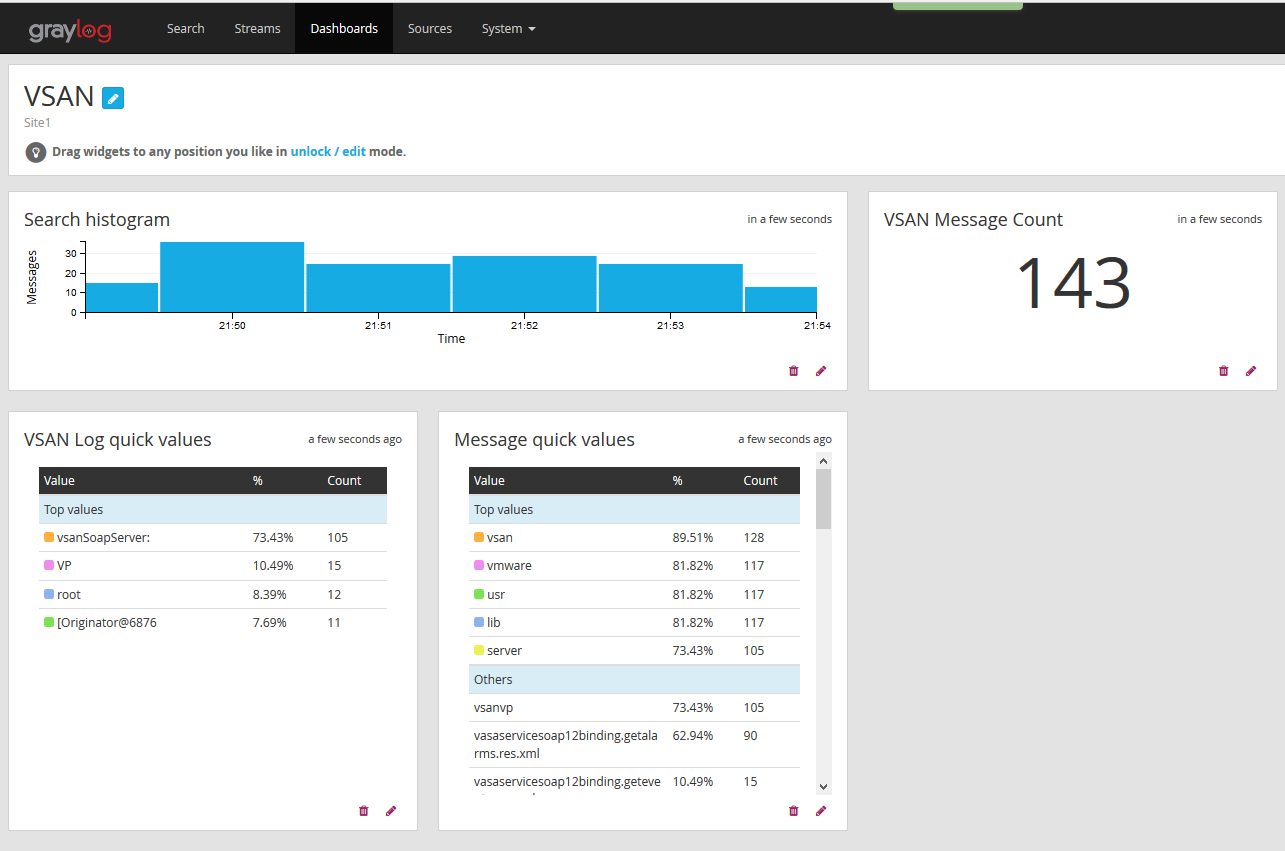
There are a few good free plugin’s and content packs that will help customise the product. API’s are exposed so that you can write your own.
Support is done through the community but can be purchased at three levels, with different SLA’s for response and different ways to contact the company. I’m not sure of the cost but I guess much of that would be around the size of your deployment.
If you don’t want to use the OVA, graylog also has official deb and rpm package repositories for Ubuntu, Centos and Debian, which make it easy to install with two or three commands. I tested both the OVA, and the package install on CentOS. Both methods were really simple to deploy.
Graylog should be a serious consideration for any company, big or small, and is very good example of an enterprise opensource project.